Anyone who has a made a dashboard in Excel before has probably experienced this problem: a dashboard that fits nicely on your screen but not so nicely on your client’s. Yes, it’s the age old problem of differing monitors, resolutions, font-sizes and other settings that make what looks great on your screen look too small or too big on another’s. I’ve seen a few ideas to get around this problem that include resizing the spreadsheet controls to resizing the Excel window. Here’s my idea.
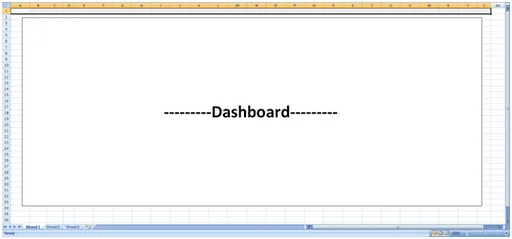
Most likely, your current Dashboard is already zoomed to its “best view.” By that I mean your current spreadsheet is at the proper zoom level such that your dashboard is displayed most effectively. If it’s not, go ahead and set it to the optimal zoom for your screen. Use the picture below as a guide for your dashboard and adjust the zoom levels (down in the lower-right corner) accordingly.
In this next step you’ll want to take note of the columns spanning your screen. Above, you’ll see that I’ve selected columns “A1:Z1,” but left the final column, “AA1” unselected. I would suggest highlighting all except for the last column as I did above—when we are finished, the last column will act as a nice margin. Jot down your selection; we’ll be using it in a moment.
Fire up the Visual Basic editor. Since we want our Dashboard to be in the correct view whenever someone opens the file (otherwise, what’s the use?) we’re going to add some code to be executed right when the workbook is first opened. In the upper-left hand corner of the Visual Basic Editor you’ll see a box labeled Project, which contains your Microsoft Excel objects. Double click ThisWorkbook—the workbook object belonging to our project.
In the code window, select “Workbook” from the object dropdown on the left. Then select the “Open” method from the method dropdown on the right. The Workbook_Open() procedure should appear on the screen as shown below.
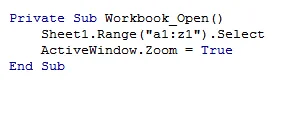
Now enter the following code into your new procedure. Remember the range I said to jot down for later? Use that range in the quotes as I have for “A1:Z1.”
!
Now to see if our code actually works! Go back to the spreadsheet and, for testing purposes, zoom really far out to a level that your dashboard should never go. Now save and quit. (Make sure you save it as a .xlsm macro enabled workbook.)
Open your dashboard! Neat, huh? If you want to make your dashboard super snazzy, take the row selection you jotted down above and do Merge and Center on it. Now add a nice title to it for a nifty dashboard banner.
—
There are a few things I should mention. The user might have to hit “Enable Macros” before the code takes effect, but there’s not a ton you can do about that. And if Excel wasn’t closed correctly on a previous use, that box showing unsaved files will most likely appear and your dashboard, left with less screen real estate, will probably not zoom correctly. Finally, sometimes Excel will not open to a maximized state – but you can fix this with some VBA code.
I’ve found this to be a good workaround in my projects– but I haven’t worked with every different client computer, either. Let me know what you guys think – was this useful? How do you get around displaying the same thing on different screens?
